Published on: 06/09/2023 · Last updated on: 13/07/2026
Introduction
The reports produced by our learning technology platforms provide data that can help to give an indication of student involvement with your online content.
The main benefit of being able to access this data is that lecturers can identify students who may be struggling to keep up with the online tasks set for them and provide access to support. Additionally, lecturers can review how often resources are viewed and provide reminders for students at important times.
The main benefit for students in being able to access their activity completion report is one of keeping track of progress. They can see what they’ve completed and what they still need to do and supports their independent learning goals.
Moodle Reports
When staff and students work in Moodle the technology logs their interactions. This information is then made available in various report functions:
- for staff so that they can understand student behaviour and analyse how students are working with the online content
- for students so that they can keep track of their progress
The following information identifies some of the most useful reports and their potential uses, but please be clear that the information does not provide evidence that learning has taken place. Rather, it gives you an indication that tasks are being attempted, or completed, that readings are being viewed or that forum posts are being made. You can see which types of activity are visited regularly and which are not so popular. With this information you can start to get a picture of how your students are interacting with the content, you and their peers.
Accessing Moodle Reports
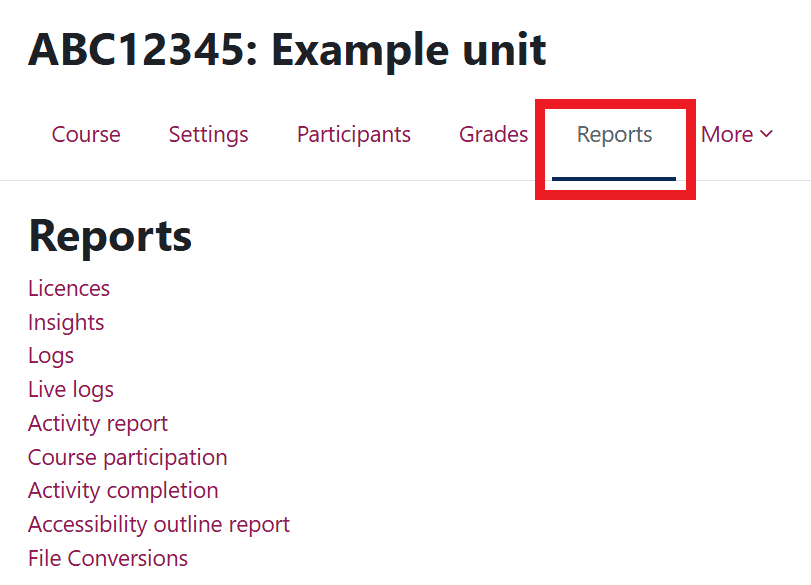
You can access Moodle Reports from your chosen Moodle space by clicking the Reports tab (underneath the Moodle space title).
Activity Report
An activity report shows the number of views for each activity and resource. An activity report is calculated from the Moodle ‘course’ start date, which is taken from the Settings tab. This can be a quick way to identify which resources or activities are popular (or not).
You can find the Activity Report link in the list of reports (shown above).

Activity Completion Report
Activity completion allows students to track their progress through the various activities you provide on your Moodle space. Students can see a checklist of what they have done so far. Using the activity completion report, staff can review student progress.
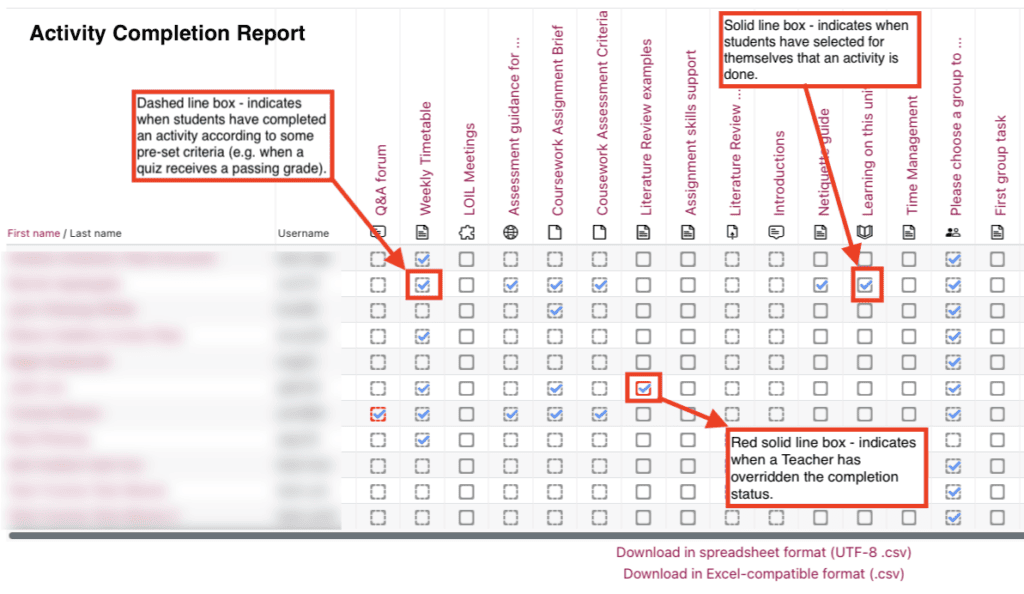
See ‘Record activity completion to monitor engagement‘ for detailed information about activity completion.
Find the Activity Completion Report link in the list of reports (shown above).
Learning Analytics
Taking this reporting further, Moodle incorporates Learning Analytics (since version 3.9). It automatically analyses data (based on specific models that have been enabled on the site) to identify patterns of behaviour (known as ‘Insights’) which help space owners to track engagement, easily monitor and contact students who may not have accessed recently/at all.
“Insights may be predictions about future performance or may detect current, hidden aspects or processes of learning. They may apply to students, courses, cohorts, or any other entity in Moodle.”
Moodle.org
In the first instance, two models will be enabled:
- Students who have never accessed the Moodle space
- Students who haven’t accessed the Moodle space in the last month
Moodle ‘course’ owners can access the ‘Insights’ reports at any time, but Moodle will also send teachers automatic notifications when new insights are identified (via email or through the Moodle messaging tool depending on your notification preference settings).
- Find the Insights Report link in the list of reports (shown above).
- The Insights Report will be listed in the Reports section IF there is anything to report, otherwise it will not be present.
Filtering on Participants
Although not a report, the Participants list can be filtered in a number of ways that can be useful:
- by enrolment method (e.g. SAMIS enrolled, Course meta link enrolled, self-enrolled etc.)
- by role (e.g. student, non-editing teacher, Teacher+ etc.)
- by group (if you have set up groups)
- by ‘inactivity’ (i.e. have not accessed the Moodle space) over a number of days, weeks or months.
To filter participants and download the results
- Select the relevant Moodle space, and then choose Participants tab at the top of the page.
- From the drop-down menus (by clicking the down arrows) select the filter options you need. You can have multiple selections (e.g. filter by SAMIS enrolment, for those in the role of Student, who have been inactive for over a week).
- Click Apply filters. The resulting list will give you a number of participants who match the criteria chosen.
- If you wish to download this list, click the check box at the top lft of your filtered list of participants and scroll down past the table of results. Click the ‘With selected users‘ drop-down menu to select a format (e.g. PDF, CSV etc.) for the downloaded file. The list will contain the names, usernames and any Groups the students are in.
Logs
The logs in Moodle create an audit trail for activity undertaken by staff or students. These logs can be viewed at Moodle ‘course’ level, and can be filtered:
- by all participants or a specific named individual
- by all days or a specific date
- by all activities or a specific activity (e.g. an assignment, forum or resource)
- by all actions or a specific action (e.g. whether a resource has been viewed or deleted, or whether an assignment has been submitted)
- by all events or a specific event (e.g. teaching or participating)
When the results are obtained, they appear on screen (in multiple pages). You are able to download the results, exported as an Excel or CSV file, where you can access more filtering options.
Note for example, you can only filter by current participants on the Moodle space. However, those log entries are there, and downloading the report as an Excel or CSV file allows you to filter to those users who have since been unenrolled from the Moodle space.
Note: there may be a delay in presenting the results if there is a lot of activity to search through.
You can find the Logs link in the list of reports (shown above).
Live Logs
These logs are a subset of the full data, showing the most recent activity (i.e. the last hour). These are only viewable on screen (i.e. no downloads) and there are no filtering options.
You can find the Live Logs link in the list of reports (shown above).
Panopto Stats / Analytics
In Panopto, folders and individual recordings both display a stats icon, where you can access data and download reports. Statistics such as viewer engagement and views by day will give you insights about how your students are using the recordings you provide them.
It might be that students are viewing more often during revision periods or that they are watching a particular part more often because they find it difficult. You can see which students on your course have viewed videos and this data is also available to download. Panopto’s help pages provide guidance about obtaining folder and recording statistics.
Please note that following the July 25 Moodle upgrade, the video below may show some minor differences from Moodle live.
Recording: How to view data about recordings
Zoom Attendance / Poll Reports
In Zoom the reporting relates to attendance and poll results.
- Meeting registers (accessible from Moodle or Zoom Cloud)
- Poll results
For attendance data only the Meeting organiser can access the data from Zoom Cloud, whereas in Moodle anyone in the Teacher role can access a Report link (from the Previous Meetings tab) to see those who participated.
If you record your Zoom meeting, the recording will be uploaded to Panopto, where you will also be able to view statistics.
MS Teams Attendance and Analytics Report
During Teams meetings it’s possible to access an attendance list.
When working in a Teams area, you can access a page of statistics summarising activity within the team. Enter your Team and from the ellipsis menu (More options) select Manage Team and then select the Analytics tab.