Published on: 03/10/2023 · Last updated on: 28/02/2025
What is needed to make figures accessible?
Students need to be able to meaningfully engage with all content, including images, diagrams, plots, etc. In order to do this, the figures need to be accessible for sighted and non-sighted readers (through provision of another method of interacting with the content: e.g. having adequate alternative text or providing another means to access the content).
Some examples where design can affect accessibility are:
- relying on colour to distinguish between different lines or points on a graph – colourblind readers can’t differentiate between the different data sets (as high as 8% in Caucasian male and female populations, respectively).
- inappropriately chosen (pseudo) colour-maps for visualisation – these can obscure interpretation, introduce artefacts and not be accessible for colourblind readers (or B&W printers) (E. Hawkins, Scrap rainbow colour scales [2015]).
- information contained in a flow diagram or graph only – without adequate support, visually impaired readers can’t access this.
Preparing visually accessible figures
Accessible figures make it easier for all readers to access content and is also useful in preparing publication-ready figures: indeed many journals and disciplines will have their own best practices (e.g., M. White, How small changes to a paper can help to smooth the review process [2019]).
Key tips:
- Ensure all fonts are large enough and in a clear typeface.
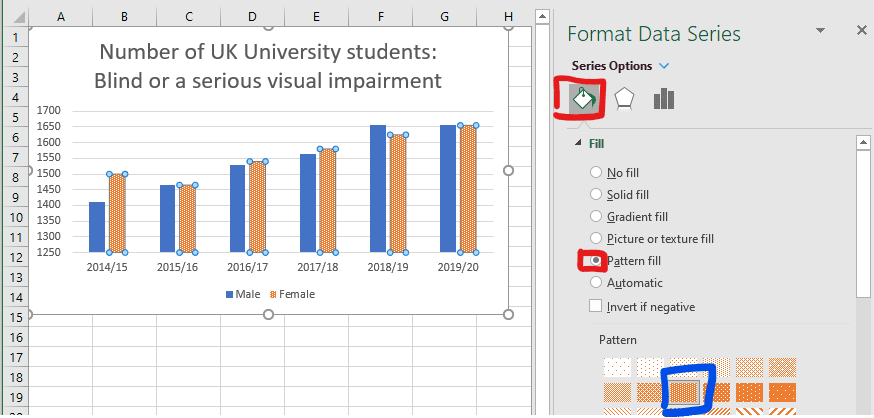
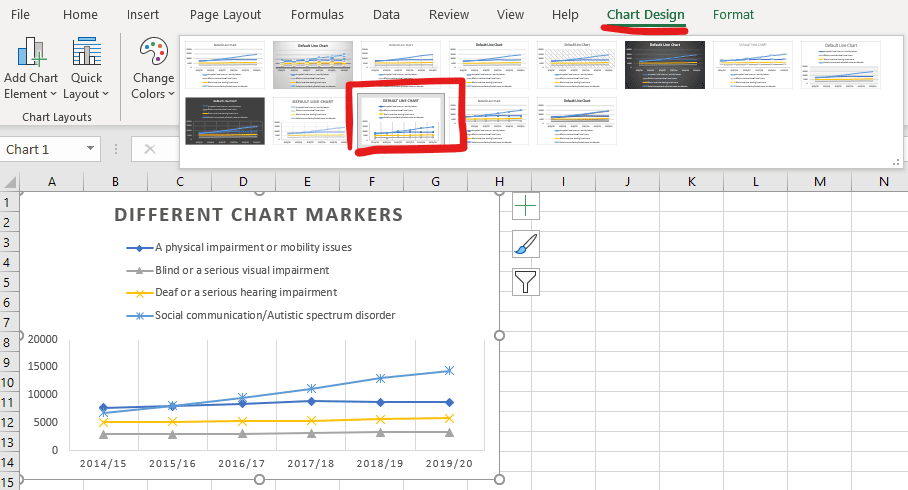
- Use textures (e.g. solid, vertical or horizontal stripes, crosshatched), line styles (e.g. solid line, dashed, dash-dotted), shapes (e.g. open circles, closed circles, diamonds) in addition to colour-only to convey meaning: this makes it accessible to colourblind and visually impaired readers (through producing tactile figures).
- For colour maps, avoid rainbow colour map and make use of contrastor saturation instead of colours.
- Avoid red and green or blue and yellow colour contrast combinations as these can appear to be low contrast for certain colour sight conditions.
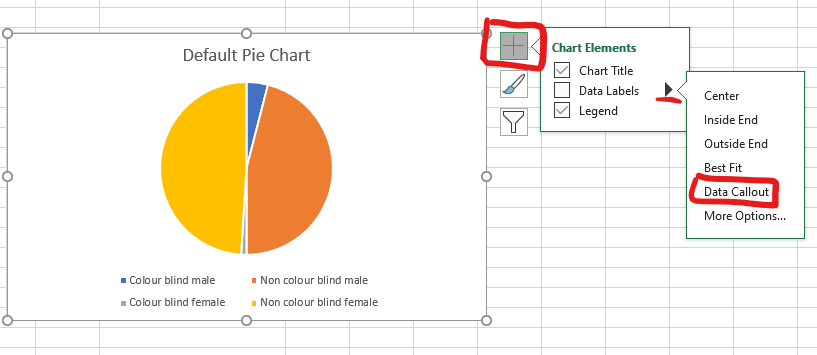
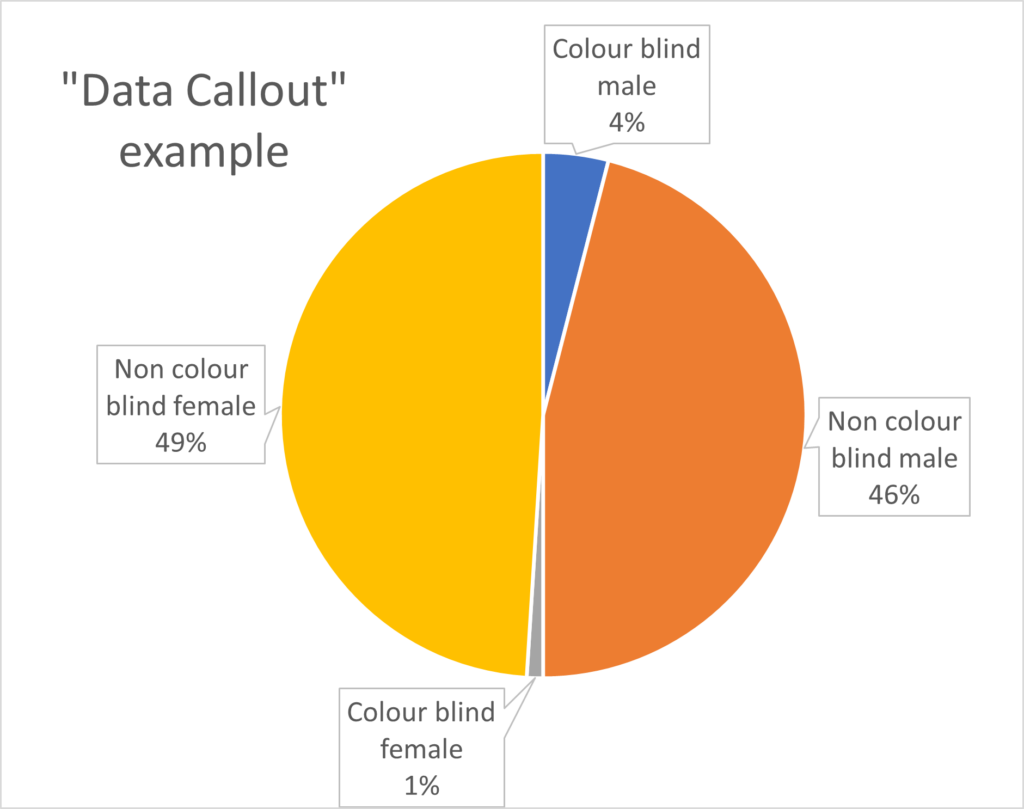
- Beware of defaults! Some programs produce figures that are not accessible by default. For example, Microsoft Excel charts (see below).
- Put yourself in another’s shoes to consider the accessibility of a figure. What would the figure look like printed in greyscale (black amd white)? Is the legend large enough to be legible?
Creating accessible charts and plots in Excel
Many of the plots created with the default settings in Microsoft Excel will NOT be digitally accessible. The guidance below gives common tips to make bar/column, pie and line/scatter plots in Excel more accessible.
Creating alternative text for technical content
Alternative text (ALT-text) is a description of an image on a webpage or digital document. It is distinct from a caption (which serves to support a figure), as ALT-text conveys the context and content of an image to a blind reader (via a screen reader) who would otherwise not be able to access it.
How to include alt-text
Everywhere an image or figure appears it is important to include alt-text to make it accessible. See guidance on how to do this for Microsoft Office packages.
Key principles for supporting technical figures with alt-text
Alt-text is a simple way to provide information to a reader who can’t access it visually. The DIAGRAMcenter.org offer these key principles in writing effective alt-text:
- Context
- the description will depend on the context it is used in: is it decorative, an illustrative example or a central learning concept?
- Concise
- be succinct and avoid repeating information presented in the main text.
- Objective
- describe physical appearances and relationships
- don’t interpret or analyse, but allow readers to form their own opinions
- Move from generic to specific
- begin with high-level context
- expand to describe detailed information
Effective alt-text examples
The DIAGRAMcenter.org have a series of examples sorted by figure type: for example bar graphs, line graphs, relational diagrams with multiple start points/paths, etc.
- Image Description Guidelines and Examples (DIAGRAM Content Working Group)
- Poet Image Description Training Tool (DIAGRAM Center)
Going beyond alt-text
In some cases, descriptive alt-text does not do an adequate job of conveying what a figure is showing. For example, it is not meaningful to tabulate scatter data for a huge number of points showing a weak correlation: a better approach could be creating a tactile diagram of the scatter plot (supported by the Assistive Technology Department). Other instances might include where an interaction is needed (this might require a visual response or motor coordination that is not accessible to all). In these cases, it is important to create a meaningful way for a student to access the content (rather than insert alt-text as a token effort), which could include working with the student and student support to find a solution.
Making sense of complex images gives a pragmatic guide to how to deal with alt-text for complex cases.
Using Desmos online graphing
Desmos is a free online tool that makes it easy to plot functions and data in 2D. Additionally, the formula and graphs are fully accessible to blind students via screen readers, braille readers, tactile diagrams and audio traces of functions (see Desmos accessibility). An example graph is shown below and you can interact with it by clicking on the edit in Desmos icon.
Like most features of accessible design, Desmos graphs also enhance the functionality for all users. Other useful features include:
- scatter data (e.g. pasted from Excel) can be plotted
- sliders can allow variables to be adjusted
- users may pan or zoom to explore the graph


